
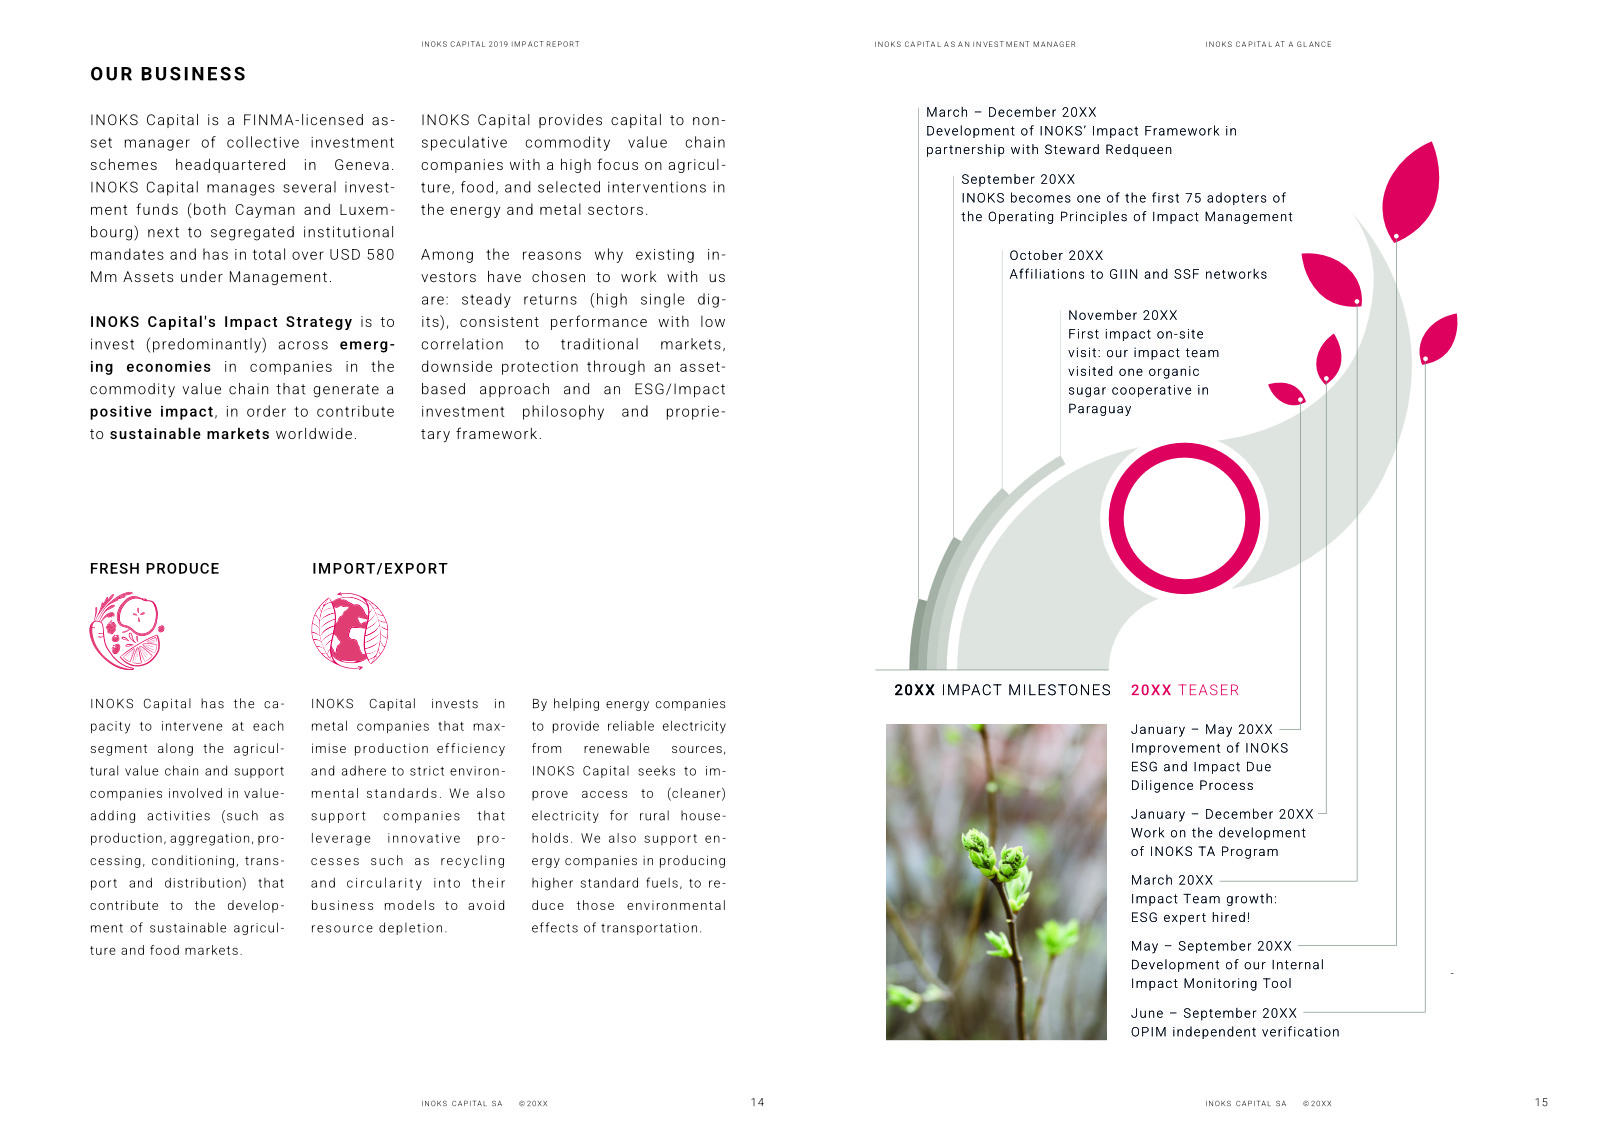
Traditional timeline visualisations treat time as a linear axis: left to right, past to future. For Inoks Capital, an investor in agriculture and emerging markets, this flat representation missed something essential: growth isn’t linear.
Below is the agricultural-inspired timeline for emerging markets investments as I have imagined it, followed by a mockup of mise en page with custom hand-drawn illustrations for a more personalised touch.

I am profoundly driven by the art and technique of simplifying complex information into digestible, illustrated, graphically pleasant elements.
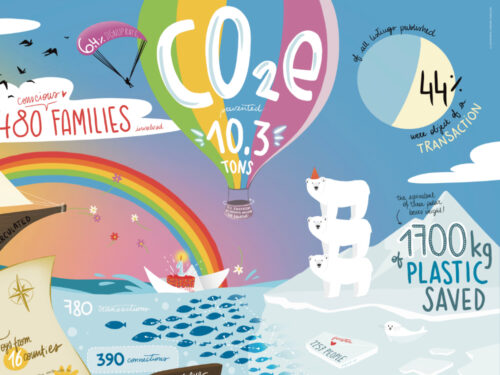
If you have an impact report you’d like to boost, investors to leave speechless, or a scientific paper you’d like to create an illustrated abstract for – please get in touch. I’d love to hear more about your project!
Related Projects

Growth Narratives for Inoks Capital
Reimagining investment milestones through the organic language of emerging market trajectories. And data visualisation at its finest.

Escalade Alsace
A selection of merchandising illustrations derived from the logo and visual identity system I designed for the climbing association.